Fundus autofluorescence (FAF) is a non-invasive imaging method that excites natural fluorophores in the fundus with light and maps their emission 7). Unlike fluorescein angiography (FA), it does not require intravenous injection of contrast agent 7).
In 1995, the intrinsic fluorescence properties of the human retina were first reported 7). Subsequently, clinical application rapidly expanded with the spread of confocal scanning laser ophthalmoscopy (cSLO).
The main fluorophore in FAF is lipofuscin (LF) that accumulates within RPE cells7)6). LF is a byproduct of incomplete lysosomal degradation of photoreceptor outer segment disc membranes and contains at least 20 bisretinoid compounds7).
The major component, A2E (N-retinylidene-N-retinylethanolamine), absorbs blue light (peak ~470 nm) and emits yellow-green light (600–610 nm)6)7). A2E generates reactive oxygen species (ROS) through photooxidation, leading to membrane destabilization and apoptosis7).
The absorption maxima of each bisretinoid are as follows7):
Fluorophore
Absorption maximum
A2E
439 nm
A2PE
449 nm
isoA2E
426 nm
A2-DHP-PE
490 nm
RPE cells phagocytose approximately 3 billion photoreceptor outer segment discs over a lifetime 6). After age 70, LF and melanolipofuscin accumulate to occupy about 25% of the RPE cytoplasmic volume 6).
Near-infrared autofluorescence (NIR-AF) excites melanin as the main fluorophore using light around 787 nm 7)6). This allows evaluation of melanin distribution in the RPE and choroid.
QWhat is the difference between FAF and FA (fluorescein angiography)?
A
FA requires intravenous injection of a contrast agent and evaluates vascular structure and the state of the blood-retinal barrier. FAF does not require a contrast agent and uses the intrinsic fluorescence of lipofuscin in the RPE to assess RPE metabolic status. The signal intensity of FAF is about 1/100th that of FA, but it provides complementary information by directly reflecting RPE damage 7).
FAF is used in the diagnosis and follow-up of a wide range of retinal and choroidal diseases.
Degenerative and Atrophic Diseases
Age-related macular degeneration (AMD) and geographic atrophy (GA): GA appears as a well-demarcated hypofluorescent area, ideal for area measurement. The hyperfluorescent pattern around GA is useful for predicting progression rate.
Stargardt disease: Characterized by fleck-like hyperfluorescence and hypofluorescence due to foveal atrophy. qAF shows approximately three times the fluorescence value of healthy individuals.
Retinitis pigmentosa (RP): A hyperfluorescent ring around the macula that contracts over time serves as an indicator of progression.
Vascular and Metabolic Diseases
Diabetic retinopathy (DR): Hard exudates appear hyperfluorescent, hemorrhages hypofluorescent, and cystoid macular edema (CME) hyperfluorescent, useful for detecting early changes.
Central serous chorioretinopathy (CSC): In chronic cases, there is a gradual change from punctate hyperfluorescence to diffuse hyperfluorescence, and then to partial hypofluorescence.
Inflammatory and neoplastic diseases
Uveitis (MEWDS, APMPPE, etc.): Hyperfluorescence in the acute phase is characteristic. Some findings disappear with photobleaching.
Choroidal melanoma: Hyperfluorescence in the orange pigment area on the tumor is a marker of malignant transformation.
The IFAG (International FAF Classification Group) classification is used to predict GA progression, with 8 patterns (normal, minimal change, focal increase, patchy, linear, lace-like, reticular, speckled)6).
The progression rates for each pattern are shown below3)6):
Pattern
Characteristics
Progression rate (mm²/year)
None/minimal
No border changes
Slowest
Diffuse trickling
Widespread punctate hyperfluorescence
Approximately 2.61
Patchy/banded
Patchy/banded
Moderate
Hypofluorescence in GA areas indicates RPE loss, while surrounding hyperfluorescence reflects RPE hypertrophy, migration of shed RPE cells, and macrophage accumulation 3).
Reticular pseudodrusen are detected as hypofluorescent spots of 50–400 μm on FAF, with higher sensitivity than color fundus photography6).
QWhich diseases are particularly useful for FAF?
A
Monitoring progression of geographic atrophy (GA), quantitative autofluorescence (qAF) in Stargardt disease, and evaluation of hyperfluorescent ring contraction in retinitis pigmentosa (RP) are especially useful. These may detect structural changes earlier than OCT or FA. See “4. Interpretation of Normal and Abnormal Findings” for details.
In standard B-FAF (blue-light FAF) imaging, after dilating the patient’s pupil (or without dilation), the patient is positioned in the device, and images are captured at the best focus while checking the live image. In cSLO type, the signal-to-noise ratio is improved by averaging multiple frames.
Photobleaching processing: By exposing the eye to intense light for about 20 seconds before imaging, the visual pigments are bleached, enhancing the FAF signal by approximately 30%2)1). This is used for evaluating acute lesions such as MEWDS.
Green-light FAF (G-FAF): This method uses 504/532 nm excitation, which has less absorption by macular pigment and is excellent for evaluating the fovea4)6). It also offers higher patient comfort.
QWhich device is most commonly used?
A
For standard outpatient examinations, cSLO type (e.g., Spectralis) is widely used. For ultra-widefield imaging, Optos is selected, and for foveal evaluation, G-FAF compatible devices are chosen. cSLO type, which can simultaneously capture OCT images, offers high alignment accuracy during follow-up and is suitable for quantitative assessments such as GA area measurement4)7).
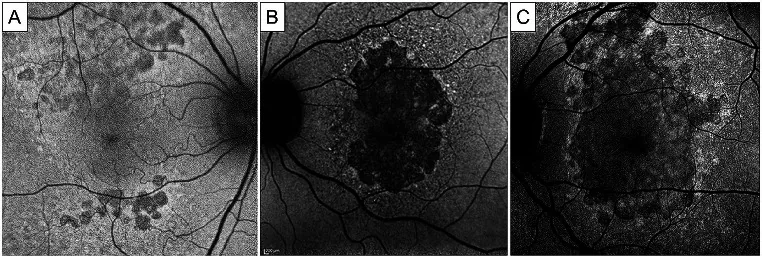
Matteo Mario Carlà; Federico Giannuzzi; Francesco Boselli; Emanuele Crincoli; Stanislao Rizzo. Extensive macular atrophy with pseudodrusen-like appearance: comprehensive review of the literature. Graefes Arch Clin Exp Ophthalmol. 2024 Aug 12; 262(10):3085-3097. Figure 2. PMCID: PMC11458735. License: CC BY.
Blue fundus autofluorescence photographs of extensive macular atrophy with pseudodrusen (EMAP), showing the classic evolution pattern. Hypoautofluorescence lobular lesions are visible in perifoveal areas, particularly the superior perifovea (A). These multifocal lesions tend to coalesce into a single patch of dark and sharply demarcated atrophy, initially not affecting the fovea (B). In advanced stages, a vertically oriented area of atrophy involves the macular region and involves the fovea (C). Note the hyperautofluorescent rim visible at the boundaries of the atrophic lesion. Courtesy of Antropoli et al. [41], Romano et al. [4] and Vilela et al. [9]
Normal findings on SW-AF (short-wavelength FAF, B-FAF):
Foveal hypoautofluorescence: The fovea appears hypoautofluorescent because xanthophyll pigments (macular pigment) absorb blue light6)7).
Optic disc hypofluorescence: Hypofluorescence occurs because the RPE is absent7).
Retinal vessel hypofluorescence: Blood absorbs light, resulting in hypofluorescence7).
Area of maximum fluorescence: The parafoveal area 5–15 degrees from the fovea shows the strongest fluorescence6).
Normal findings on NIR-AF (near-infrared autofluorescence):
Because the fovea has a high melanin density, it appears hyperfluorescent on NIR-AF, in contrast to SW-AF6)7). This is an important difference from SW-AF.
The mechanism of hyperfluorescence is classified into primary and secondary increases2).
Primary increase: Excessive production of bisretinoids due to dysfunction of ABCA4 and RDH12. Corresponds to Stargardt disease and RDH12-associated retinal dystrophy.
Secondary elevation: Bisretinoid accumulates downstream following photoreceptor damage. Occurs secondary to photoreceptor death in RP or other causes.
Differentiation from photobleaching: If hyperfluorescence disappears after photobleaching, it may be pseudo-hyperfluorescence due to fluorescence of visual pigment (rhodopsin)1).
QIs hyperfluorescence always a pathological finding?
A
Hyperfluorescence can also occur due to decreased macular pigment (aging, sunlight exposure) or photobleaching. Use OCT to check for structural changes and differentiate from true pathological hyperfluorescence. Since appearances may differ between devices, it is important to use the same device for longitudinal comparisons4)7).
Fluorescence is a phenomenon in which a molecule that has absorbed a photon emits a lower-energy photon when returning from an excited state to the ground state7). The emitted light always has a longer wavelength (lower energy) than the absorbed light (Stokes shift).
The formation pathway of the main component of LF, A2E, is as follows7)2):
Photoisomerization of 11-cis-retinal: All-trans-retinal is produced upon light reception.
Reaction with phosphatidylethanolamine (PE): All-trans-retinal condenses with PE to form N-retinylidene-PE (NRPE).
NRPE → A2-GPE: Within the disc membrane, NRPE reacts with a second molecule of all-trans-retinal to form A2-GPE (A2E precursor).
Hydrolysis of A2-GPE → A2E: After disc membrane phagocytosis by the RPE, A2-GPE is hydrolyzed in lysosomes to generate A2E.
Role of ABCA4: The ABC transporter ABCA4 transports NRPE to the cytoplasmic side of the disc membrane and promotes its reduction to all-trans-retinol 2). In ABCA4 deficiency (cause of Stargardt disease), NRPE remains within the disc membrane, leading to excessive accumulation of bisretinoids.
Melanin is the main fluorescent substance for NIR-AF (787 nm excitation) and is distributed in the RPE and choroid7)6). Age-related decrease in melanin is observed as a reduction in NIR-AF signal. Melanolipofuscin (a complex of melanin and LF) also contributes to the NIR-AF signal.
qAF is a quantitative fluorescence value corrected using an internal fluorescence reference (standard fluorescent substance in a cuvette) under 488 nm excitation 2)7). qAF values vary with age, eccentricity, sex, and race, and standardization remains a challenge.
FLIO is a technique that measures the fluorescence decay curve (lifetime) specific to each fluorescent substance, allowing identification of the type of fluorescent substance in addition to fluorescence intensity 6)7). Currently, it is mainly used for research purposes.
qAF is increasingly being adopted as an objective indicator of disease progression in hereditary retinal diseases such as Stargardt disease and retinitis pigmentosa for clinical trial endpoints 2). Challenges include calibration of devices and standardization of measurement protocols.
In clinical trials for geographic atrophy (GA) treatment using pegcetacoplan (APL-2) and avacincaptad pegol (Zimura), FAF imaging-based measurement of GA area has been adopted as the primary endpoint 4). It has been reported that B-FAF tends to overestimate GA area, while G-FAF is superior for evaluating central lesions 4).
A model combining Optos ultra-widefield FAF images with deep learning algorithms has been reported for detecting age-related macular degeneration, enabling early lesion detection with high sensitivity 6).
In automated classification of inherited retinal diseases, a neural network reportedly identified Stargardt disease, Best disease, and RP with approximately 95% accuracy 5).
G-FAF is less affected by foveal macular pigment and excels at detecting foveal lesions that are difficult to observe with SW-AF 4). It also causes less glare for patients, offering an advantage in comfort. Wider adoption is expected in the future.
Fluorescence lifetime imaging (FLIO) shows disease-specific fluorescence lifetime patterns in age-related macular degeneration, Stargardt disease, and diabetic maculopathy, and may detect metabolic changes before intensity-based FAF does 7).
Multimodal imaging integrating FAF, OCT, OCT-A, and FA is establishing a diagnostic system that compensates for the limitations of each examination method 4).
QWhat is the future development of FAF?
A
Main prospects include quantitative disease monitoring through standardization of qAF, automated diagnosis using AI and deep learning (approximately 95% accuracy for inherited retinal diseases), clinical application of FLIO, and widespread use of G-FAF 5)6). FAF has been adopted as a primary endpoint in clinical trials for geographic atrophy treatments, and its importance in future retinal care is expected to increase further 4).
Mantovani A, Corbelli E, Sacconi R, et al. Blue-light fundus autofluorescence in inflammatory photoreceptor diseases. Diagnostics. 2023;13(14):2466.
Parmann R, Bhatt M, Sarraf D, et al. Primary versus secondary autofluorescence elevations in inherited retinal dystrophies. Int J Mol Sci. 2023;24(15):12327.
Curcio CA, Messinger JD, Berlin A, Sloan KR, McLeod DS, Edwards MM, Bijon J, Freund KB. Fundus Autofluorescence Variation in Geographic Atrophy of Age-Related Macular Degeneration: A Clinicopathologic Correlation. Investigative ophthalmology & visual science. 2025;66(1):49. doi:10.1167/iovs.66.1.49. PMID:39836402; PMCID:PMC11756612.
Antonia-Elena Ranetti, Horia Tudor Stanca, Mihnea Munteanu, Raluca Bievel Radulescu, Simona Stanca. Blue Light and Green Light Fundus Autofluorescence, Complementary to Optical Coherence Tomography, in Age-Related Macular Degeneration Evaluation. Diagnostics. 2025;15(13):1688. doi:10.3390/diagnostics15131688.
Oh J, Lee CS, Kim JM, et al. Fundus autofluorescence in inherited retinal disease. J Clin Med. 2025;14(7):2293.
Nedime Şahinoğlu Keşkek, Figen Şermet. The Use of Fundus Autofluorescence in Dry Age-Related Macular Degeneration. tjo. 2021;51(3):169-176. doi:10.4274/tjo.galenos.2020.49107.
Pole C, Ameri H. Fundus Autofluorescence and Clinical Applications. Journal of ophthalmic & vision research. 2021;16(3):432-461. doi:10.18502/jovr.v16i3.9439. PMID:34394872; PMCID:PMC8358768.
Copy the article text and paste it into your preferred AI assistant.
Article copied to clipboard
Open an AI assistant below and paste the copied text into the chat box.