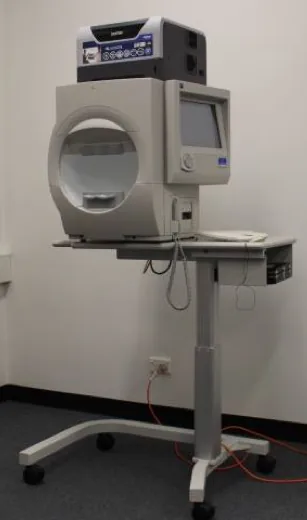
External photograph of the Humphrey Field Analyzer (HFA), showing the bowl (hemispherical dome) where the patient places their face, the control panel, and the response button holder, illustrating the overall appearance of the automated static perimeter. This corresponds to the measurement principle and device structure of the bowl-type static perimeter discussed in the section “1. What is the Humphrey Static Visual Field Test (HFA)?”
HFA (Humphrey Field Analyzer) is a representative model of static perimetry. It measures light sensitivity (threshold) at each test point by varying the brightness of a fixed target and creates an isosensitivity map of the central visual field.
With the widespread use of OCT, it has become possible to identify abnormal findings that cannot be detected by fundus examination. However, consistency between structure and function is essential for a definitive diagnosis of eye diseases, and the importance of visual field testing has not diminished. Visual field testing plays a central role not only in the diagnosis of glaucoma but also in follow-up observation 1).
While the Goldmann perimeter (GP) moves a stimulus from the periphery to the center to create isopters (lines of equal sensitivity), static perimetry measures sensitivity by keeping the stimulus fixed and varying its luminance. Due to this difference in measurement principle, static perimetry is more sensitive than GP in detecting localized visual field defects. In particular, in glaucoma, even when GP is normal, static perimetry can detect isolated scotomas, allowing early diagnosis in some cases.
Evaluation of end-stage residual peripheral visual field, difficult cases
Static perimetry is more sensitive than kinetic perimetry in detecting visual field abnormalities in early glaucoma1). Static perimetry is recommended for glaucoma management 1). Kinetic perimetry is useful for patients who cannot undergo automated perimetry and for evaluating residual peripheral visual fields in advanced stages 1)3).
The Humphrey Field Analyzer (HFA) and Octopus perimeter are widely used as major perimeters 1). The HFA uses a background illumination of 31.5 asb and performs testing under photopic conditions, primarily testing cone cells. Stimuli are presented for 0.2 seconds, measuring a sensitivity range of 50 dB.
QHow to differentiate between HFA and Goldmann perimetry?
A
HFA is superior in detecting visual field abnormalities in early glaucoma, providing quantitative and highly reproducible results, making it the standard test for glaucoma diagnosis and follow-up 1)3). On the other hand, the Goldmann perimeter (kinetic perimetry) is useful for evaluating residual peripheral visual fields in end-stage glaucoma, patients who have difficulty undergoing HFA (e.g., those with advanced dementia who cannot maintain concentration), and for assessing peripheral visual fields outside the central 24–30°. GP may also be chosen for retinal or optic nerve diseases with large central scotomas. However, GP results depend on the examiner’s skill, which may make progression assessment difficult 1).
The HFA has several measurement programs for different purposes 1)4).
Central 24-2: Measures 54 points at 6° intervals. Standard program for the central 24°. Most commonly used.
Central 30-2: Measures 76 points at 6° intervals. Covers the central 30°. Standard and comprehensive.
Central 10-2: Precisely measures the central 10° with 68 points at 2° intervals. Useful for evaluating macular disorders and end-stage glaucoma4)5).
24-2c: Includes 10 additional macular points in the 24-2, totaling 64 points.
Peripheral 60-4: Used for evaluating optic nerve diseases (e.g., superior limbic keratitis).
About 90% of glaucoma develops within the central 30°, so 24-2 or 30-2 is standard for follow-up 1). When OCT suggests macular damage, adding a 10-2 test is recommended. EGS does not recommend reducing the frequency of 24/30° tests with 10-2 testing 3).
SITA Standard: Approximately 7 minutes per eye. Reduces test time by about half with accuracy equivalent to full threshold. The most recommended standard program 3)
SITA Fast: Approximately 4 minutes per eye. Suitable for screening, elderly, and children. Variability is slightly larger.
SITA Faster: Approximately 2 minutes per eye. Reduces SITA Standard test time by 50%. Allows quick approximate assessment.
Full Threshold: Most accurate but long test time. Required when using size I or II stimuli 6)
Octopus Perimeter Algorithms
Dynamic Strategy: Recommended for glaucoma diagnosis and follow-up 3)
TOP Strategy: Allows short test time but has different characteristics from SITA and Dynamic Strategy 3)
G1 Program: Test point arrangement considering the central density of retinal ganglion cells
Eye Suite™: Enables progression assessment mainly using trend analysis
QWhen is a 10-2 test necessary?
A
The 10-2 test is a program that precisely measures the central 10° at 2° intervals. It is useful when visual field defects involve the fixation point or are near the fixation point 4)5). Also, when 24-2 or 30-2 is normal but OCT suggests thinning of the macular retinal inner layers, adding a 10-2 test is recommended to detect early central visual field defects 5). It is also essential for managing end-stage glaucoma where the visual field remains only around the fixation point. Even in pre-perimetric glaucoma, central damage may be present.
3. Examination Techniques and Tips for Improving Accuracy
The accuracy of visual field testing is greatly influenced by the patient’s understanding and cooperation, as well as the examiner’s appropriate involvement.
Share patient information during the examination (fatigue, concentration, comprehension) with the physician.
Perform a comprehensive evaluation after confirming consistency with fundus findings.
Initial examinations often have insufficient learning effects and low reliability. It is desirable to perform the second and subsequent examinations early 1).
Upper visual field defect due to ptosis: Can be reduced by fixing the upper eyelid with tape. Differentiation from glaucomatous superior arcuate scotoma is important.
Peripheral ring-shaped defect due to improper distance from the lens holder: Set the distance between the lens holder and the eye appropriately (about 12 mm).
Overall sensitivity decrease due to miosis: Sensitivity decreases when pupil diameter is less than 3 mm. Consider examination after dilation.
4. Interpretation of results and diagnostic criteria
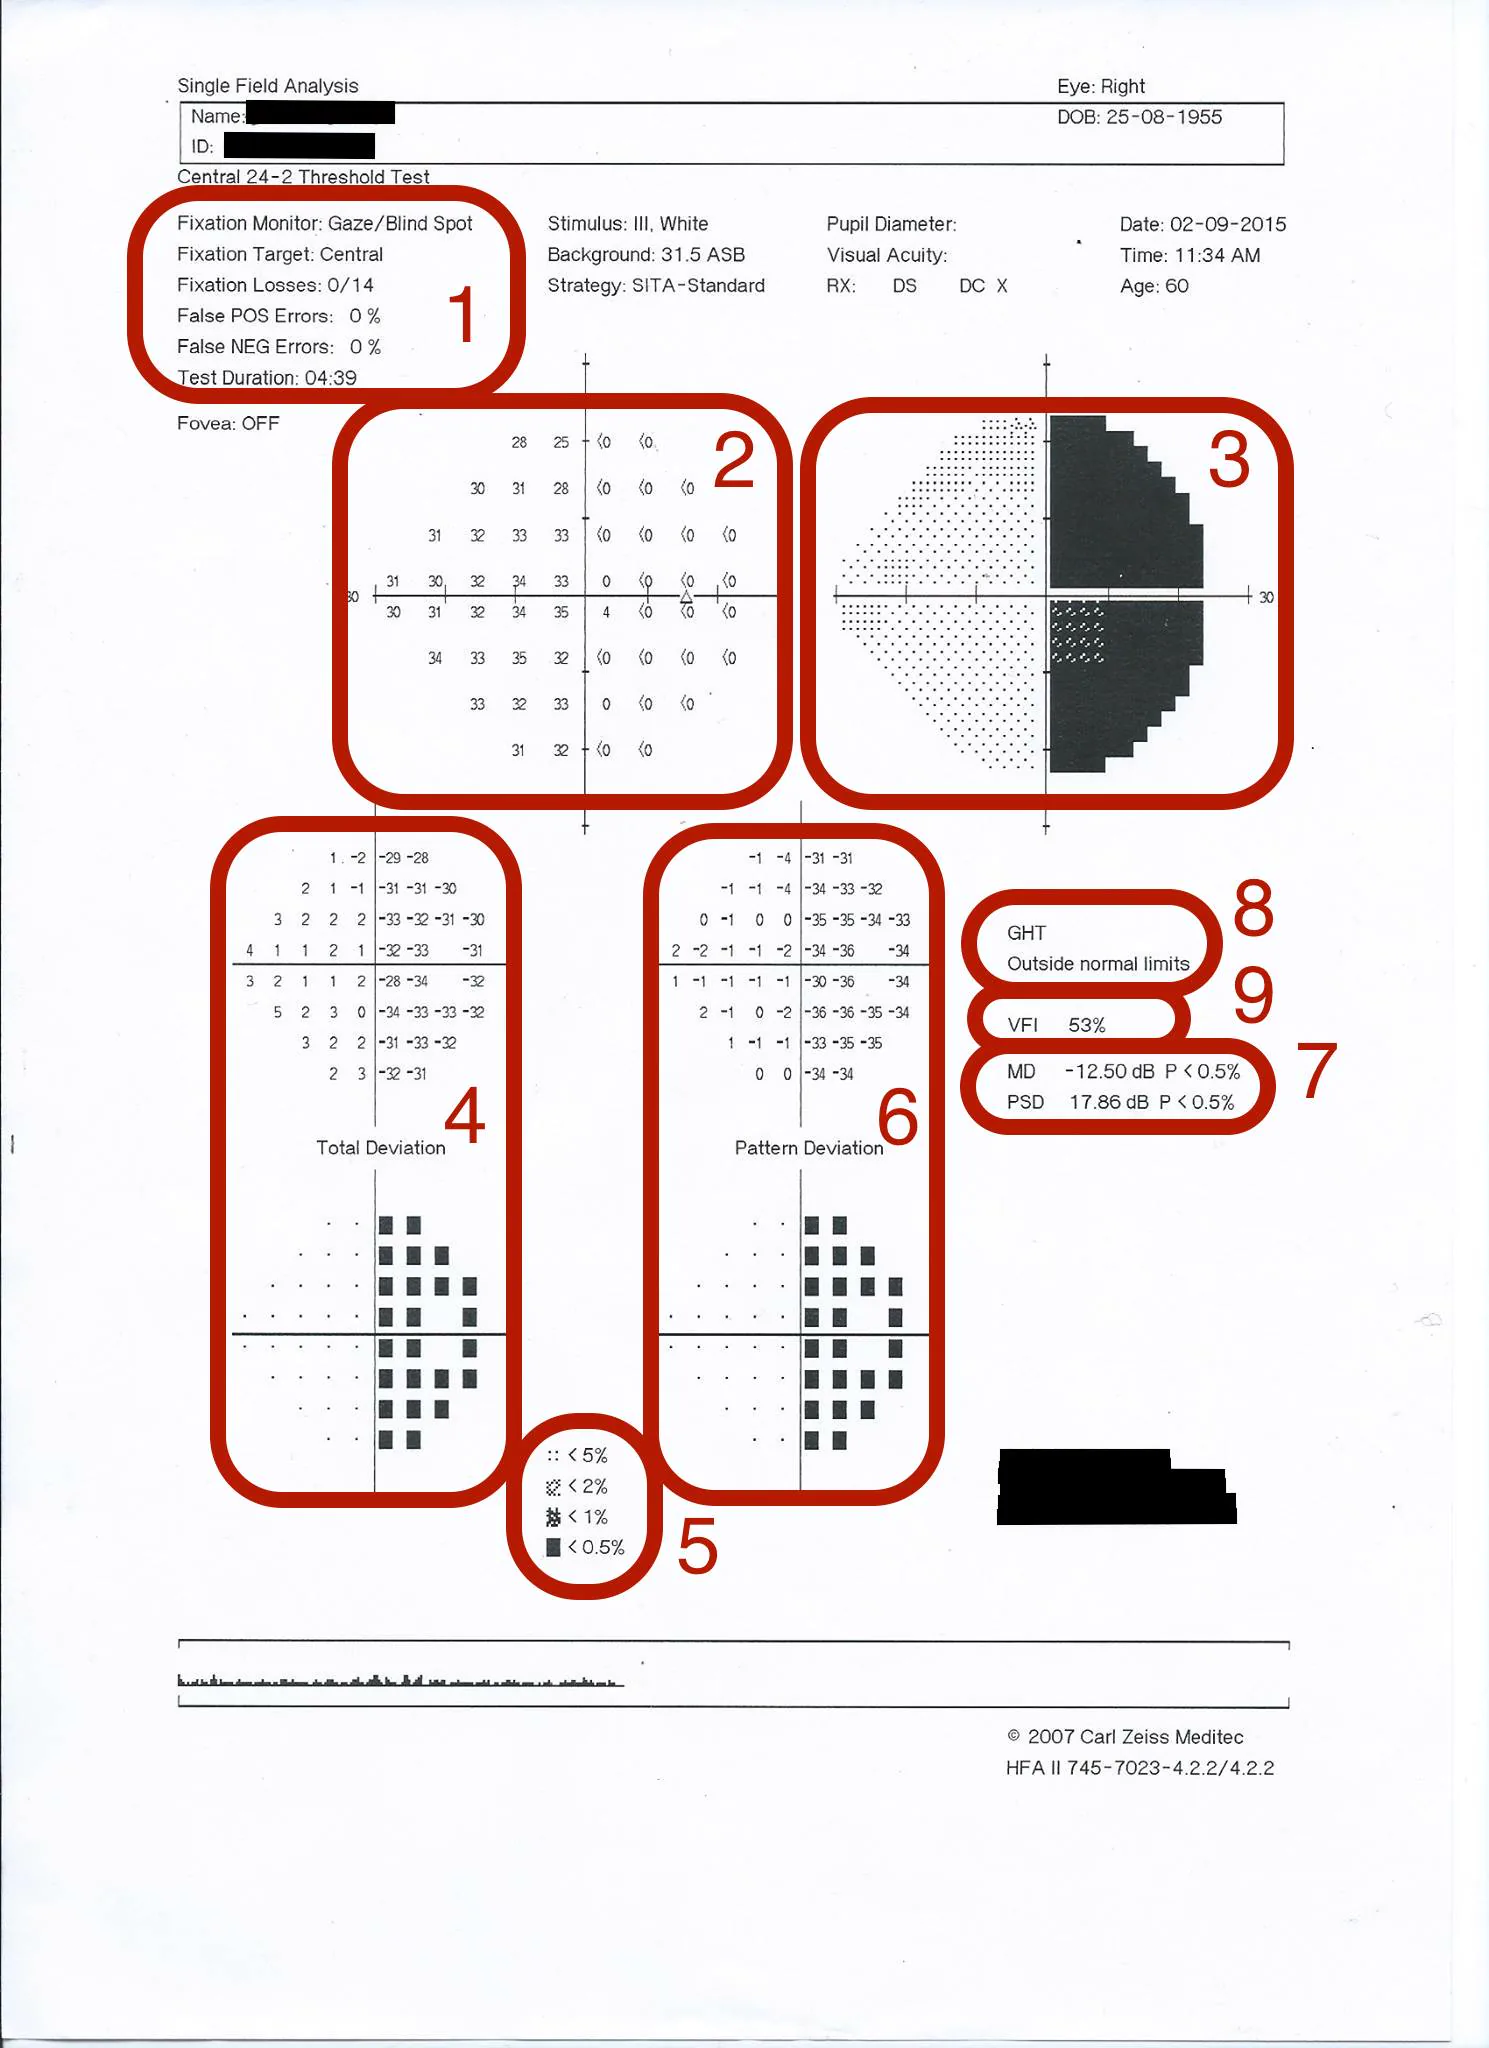
HFA 24-2 Single Field Analysis result printout showing all 8 areas numbered: reliability indices (1), numeric threshold map (2), grayscale (3), total deviation (4), pattern deviation (6), GHT “Outside normal limits” (8), VFI 53%, MD −12.50 dB, PSD 17.86 dB (7). Corresponds to the reading of grayscale, deviation map, GHT, MD, PSD, and VFI indicators discussed in section “4. Interpretation of results and diagnostic criteria”.
Grayscale (GS): Interpolates sensitivity thresholds of adjacent measurement points and visualizes them with 10-level gray tone symbols. Useful for grasping the overall visual field image, but since it is interpolated data, judgment based solely on this is risky.
Total Deviation (TD): A map display of the difference (in dB) between the patient’s measured values and age-matched normal values. Larger negative values indicate worse visual field. Affected by cataracts, miosis, etc.
Pattern Deviation (PD): An index that subtracts overall sensitivity reduction (due to miosis, cataracts, etc.) from TD, highlighting localized visual field defects. Excellent for detecting early glaucoma abnormalities. If there is a large difference between TD and PD, suspect the influence of the ocular media (lens, cornea).
Glaucoma Hemifield Test (GHT): Divides the upper and lower hemifields into five symmetrical zones considering the course of the retinal nerve fiber layer, and determines glaucomatous visual field abnormalities. As a standalone evaluation method, it has the highest detection power for glaucoma.
The following criteria are used to determine glaucomatous visual field defects1). A glaucomatous visual field defect is diagnosed if any of the following are met:
On the pattern deviation plot, excluding the outermost rim, at least 3 contiguous points with p<5%, with at least one point at p<1%
PSD or CPSD with p<5%
GHT outside normal limits
The GHT five-level classification consists of “Outside Normal Limits”, “Borderline”, “Generalized Reduction of Sensitivity”, “Abnormally High Sensitivity”, and “Within Normal Limits”. “Outside Normal Limits” is the most suggestive of glaucoma.
QWhy is GHT effective for detecting glaucoma?
A
GHT divides the visual field into five zones symmetrical between the upper and lower hemifields, considering the course of the retinal nerve fiber layer, and compares the differences between corresponding zones. Since glaucomatous visual field damage is characterized by asymmetry between the upper and lower hemifields, GHT is a method that directly reflects this feature 1). As a standalone evaluation method, it is considered to have the highest detection power for glaucoma. However, even if GHT is “Outside Normal Limits”, it does not necessarily mean glaucoma; correlation with other clinical findings is necessary. Also, in end-stage glaucoma, damage extends to both hemifields, so the sensitivity of GHT may decrease.
5. Assessment of Visual Field Progression and Test Frequency
At least five visual field tests are required for progression assessment, and more test points are desirable 1).
Event analysis: Determines whether the change from baseline exceeds a preset threshold. Used in large-scale RCTs (EMGT, AGIS, CIGTS, UKGTS) 2)3). Confirmatory tests are required, and there is a disadvantage that longitudinal evaluation at sites of reduced sensitivity becomes difficult.
Trend analysis: Calculates the rate of progression (dB/year or %/year) by linear regression of MD or VFI over time 2)3). Allows continuous evaluation from early to advanced stages. Usually requires at least two years of follow-up and a sufficient number of tests to calculate the rate of progression.
Recommended Test Frequency
First two years after diagnosis: Three SAP tests per year are recommended 2)3)
Determining progression rate: Usually requires at least two years and a sufficient number of tests 2)3)
Progression of glaucomatous visual field defect (worsening MD, persistent GHT abnormality): Reassess target IOP and intensify treatment
Hemianopia (nasal or temporal visual field defect along the horizontal midline): Exclude intracranial disease with head MRI/CT
Central scotoma (decreased sensitivity around fixation point): Examine macular disease with OCT and fluorescein angiography
QHow many visual field tests are needed to determine progression?
A
At least 5 visual field measurements are required to determine progression, and more measurement points are desirable1). For newly diagnosed patients, 3 tests per year in the first 2 years are recommended2)3). Higher testing frequency makes progression assessment easier1). Trend analysis usually requires at least 2 years of follow-up and sufficient number of tests2)3). Confirmation tests are essential for event analysis. Since the first test often has insufficient learning effect and low reliability, baseline data from the first test should be handled with caution1).
Detection of visual stimuli depends on the neural pathway: photoreceptors → bipolar cells → retinal ganglion cells (RGCs) → lateral geniculate nucleus → occipital cortex. Visual field defects in glaucoma result from RGC damage 1).
The three main types of RGCs are as follows:
P cells (parvocellular): Most numerous, transmit color and form information
M cells (magnocellular): Transmit flicker and motion information
K cells (koniocellular): Involved in short-wavelength (blue) transmission. Few in number with no redundancy
SAP uses a non-selective white stimulus, thus stimulating multiple RGC types simultaneously. Due to this redundancy, a considerable number of RGCs may be lost before visual field defects become apparent on SAP.
RNFL course and glaucomatous visual field defect patterns
The axons of RGCs form the retinal nerve fiber layer (RNFL), which is divided into three regions: nasal fibers, papillomacular bundle, and arcuate fibers.
Glaucomatous visual field damage shows characteristic patterns corresponding to structural changes 1). Early damage tends to occur in the Bjerrum area, 5° to 25° from fixation. Damage to arcuate fibers produces arcuate scotomas (Bjerrum scotomas), which become step-like defects on the nasal side. Glaucomatous visual field defects do not cross the horizontal midline.
Nasal fibers and the papillomacular bundle are preserved until late in the disease, so even in advanced glaucoma, an “island of vision” remains centrally or temporally.
In myopic eyes, localized RNFL defects and corresponding visual field defects due to peripapillary pits have been reported 7). Since scotomas caused by pits are similar to glaucomatous scotomas, careful differentiation is required 7).
All major glaucoma clinical trials have used SAP4)5). Alternative tests include SWAP (short-wavelength automated perimetry) and FDT (frequency doubling technology).
SWAP: Uses the K-cell pathway, measuring with a blue stimulus on a yellow background. It may detect visual field defects up to 5 years earlier than SAP. SITA SWAP has improved test time and variability. However, inter-test variability is greater than SAP, and it is affected by cataracts.
FDT: Preferentially targets the M-cell pathway. It has lower inter-test variability than SAP, which may be advantageous for progression monitoring. The Matrix version has improved spatial resolution.
Standard Goldmann size III is larger than Ricco’s area (critical area for complete spatial summation) for most test points in the central visual field, limiting sensitivity for detecting shallow defects 6). Smaller stimuli (size I, II) have significantly higher signal/noise ratios and can reveal shallow defects not detected by standard size III 6). In patients with chiasmal compression, visual fields that were normal with size III were detected as bitemporal superior defects with size I and II 6).
European Glaucoma Society. European Glaucoma Society Terminology and Guidelines for Glaucoma, 5th Edition. Br J Ophthalmol. 2021 Jun;105(Suppl 1):1-169. doi:10.1136/bjophthalmol-2021-egsguidelines. PMID:34675001.
Pazos M, Traverso CE, Viswanathan A; European Glaucoma Society. European Glaucoma Society - Terminology and guidelines for glaucoma, 6th Edition. Br J Ophthalmol. 2025;109(Suppl 1):1-212. doi:10.1136/bjophthalmol-2025-egsguidelines. PMID:41026937.
Gedde SJ, Vinod K, Wright MM, et al. Primary Open-Angle Glaucoma Preferred Practice Pattern. Ophthalmology. 2021 Jan;128(1):P71-P150. doi:10.1016/j.ophtha.2020.10.022. PMID:34933745.
Gedde SJ, Lind JT, Wright MM, Chen PP, Muir KW, Vinod K, Li T, Mansberger SL; American Academy of Ophthalmology Preferred Practice Pattern Glaucoma Panel. Primary Open-Angle Glaucoma Suspect Preferred Practice Pattern. Ophthalmology. 2021 Jan;128(1):P151-P192. doi:10.1016/j.ophtha.2020.10.023. PMID:33189698.
Tsai NY, Horton JC. Smaller spot sizes show bitemporal visual field defects missed by standard Humphrey perimetry. American journal of ophthalmology case reports. 2025;40:102448. doi:10.1016/j.ajoc.2025.102448. PMID:41140348; PMCID:PMC12546789.
Kita Y, Hollό G, Narita F, Kita R, Hirakata A. Myopic peripapillary pits with spatially corresponding localized visual field defects: a progressive Japanese and a cross-sectional European case. Case Rep Ophthalmol. 2021;12:350-355.
Copy the article text and paste it into your preferred AI assistant.
Article copied to clipboard
Open an AI assistant below and paste the copied text into the chat box.
