
Contrast Sensitivity Testing
Key points at a glance
Section titled “Key points at a glance”1. What is contrast sensitivity testing?
Section titled “1. What is contrast sensitivity testing?”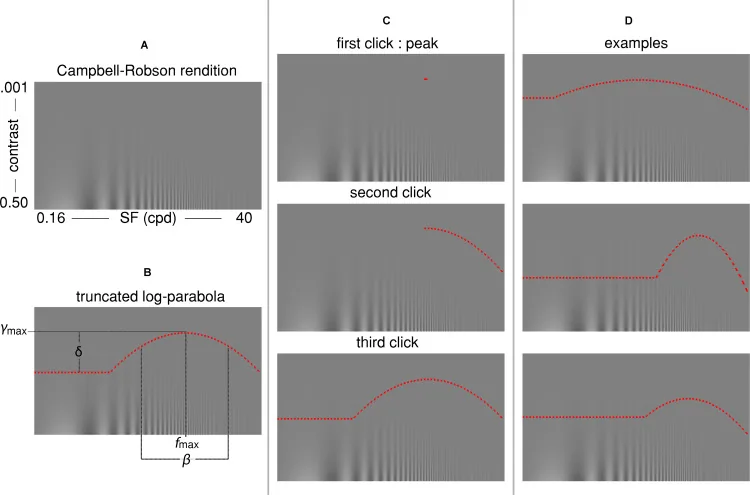
Contrast sensitivity testing is a visual function test that measures the ability to detect striped grating patterns (sine wave grating) at different spatial frequencies (cycles per degree: c/d). It evaluates aspects of visual function that cannot be assessed by visual acuity testing (the inverse of the contrast threshold at the highest spatial frequency), and is especially useful in cases where subjective visual function is reduced even though visual acuity is preserved.
Spatial frequency refers to the number of light and dark cycles contained within one degree of visual angle. The contrast sensitivity function (CSF) is a graph with spatial frequency (c/d) on the horizontal axis and contrast sensitivity (the inverse of contrast threshold) on the vertical axis. In a normal adult eye, it shows an inverted U-shaped band-pass pattern. The peak is at intermediate frequencies (3 to 6 c/d), and sensitivity declines at both the high- and low-frequency ends. Sensitivity decreases across all frequency bands with aging.
Because visual function declines in the order of contrast sensitivity and then visual acuity, measuring contrast sensitivity is useful when a patient reports blurring but visual acuity is still normal. Subjective complaints such as “blurred vision,” “glare,” and “poor night vision” often correlate with reduced contrast sensitivity.
The history of contrast sensitivity testing began with studies by de Lange and others in 1952 on temporal and spatial contrast sensitivity properties using sinusoidal gratings. In 1988, Pelli and Robson developed a standard chart that could be used clinically, and it became widely adopted as a clinical test1).
It can objectively detect a qualitative decline in visual function that cannot be assessed with a visual acuity test. Even when visual acuity is normal, if there are complaints such as “blurred vision,” “difficulty seeing at night,” or “strong glare,” measuring contrast sensitivity can quantify visual dysfunction caused by cataract, posterior capsular opacification, irregular corneal astigmatism, or optic nerve disease. In particular, with fibrotic posterior capsular opacification, contrast sensitivity may be selectively reduced even when visual acuity is preserved, so it can help determine whether Nd:YAG laser capsulotomy is indicated.
2. Test methods (chart, procedure, and interpretation)
Section titled “2. Test methods (chart, procedure, and interpretation)”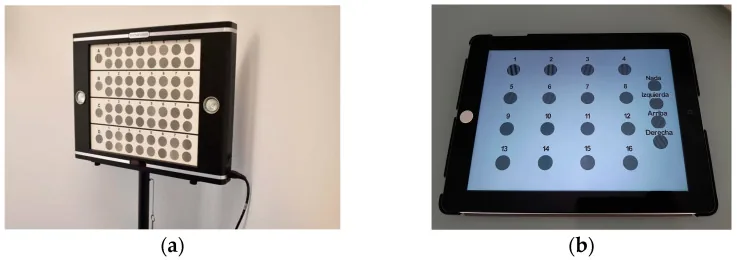
Main test charts
Section titled “Main test charts”| Chart name | Spatial frequency | Contrast level | Features |
|---|---|---|---|
| Pelli-Robson chart | Equivalent to 1 c/d (fixed) | 8 levels, 3 letters each | Simple and widely used. Letter size is constant; only contrast changes. |
| FACT (Functional Acuity Contrast Test) | 1.5/3/6/12/18 c/d (5 levels) | 9 contrast levels | Allows detailed visualization of the contrast sensitivity function (CSF) at multiple spatial frequencies. |
| CSV-1000 (Vector Vision) | 3/6/12/18 c/d (4 levels) | 8 contrast levels | Backlit panel. Quantitative assessment is possible at each spatial frequency |
| CGT-2000 (Takagi Seiko) | Multiple spatial frequencies | Stepwise | LCD display system. Used in Japan |
The Pelli-Robson chart presents letters of a fixed size (about the equivalent of 1 c/d) and measures contrast by gradually lowering only the contrast. The level at which at least 2 of 3 letters can be read correctly at the lowest contrast is recorded in log units. It is widely used for screening and for monitoring cataract and optic nerve diseases 1).
FACT and CSV-1000 measure sensitivity at multiple spatial frequencies and make it possible to understand the overall shape of the CSF. They can identify disease-specific patterns, such as selective loss of sensitivity at high spatial frequencies in irregular corneal astigmatism and broad loss of sensitivity across all frequency bands in optic nerve diseases 2).
Testing procedure
Section titled “Testing procedure”- Test distance: Varies by chart (Pelli-Robson: 1 m, FACT/CSV-1000: 3 m)
- Illumination and luminance: A uniform background luminance of around 85 cd/m² is recommended
- Correction: Measure one eye at a time under full refractive correction
- Procedure: Record the lowest contrast level that can be identified at each spatial frequency and plot the CSF
Reference values for normal
Section titled “Reference values for normal”- Peak sensitivity in healthy adult eyes: contrast sensitivity 100–400 at mid spatial frequencies (3–6 c/d) (contrast threshold 0.25–1%)
- Pelli-Robson chart: in healthy adults, log contrast sensitivity 1.65–1.95 (contrast threshold 2–3%)1)
- With aging, sensitivity decreases across all frequency bands, and people in their 60s show about a 0.3 log-unit decrease compared with young adults3)
For screening and follow-up, the Pelli-Robson chart is simple and widely used. For detailed evaluation by spatial frequency, use FACT or CSV-1000. Because FACT can depict the full CSF at five spatial frequencies (1.5–18 c/d), it is useful for identifying disease-specific patterns of sensitivity loss. For comparisons before and after multifocal IOL surgery, and for detailed evaluation of optic nerve and corneal diseases, multiple spatial-frequency charts are recommended.
3. Relationship between contrast sensitivity and visual acuity
Section titled “3. Relationship between contrast sensitivity and visual acuity”Because visual acuity (Visual Acuity: VA) is defined as the reciprocal of the contrast threshold on the high-spatial-frequency side, it is only one point on the contrast sensitivity function (CSF) curve. By assessing the entire CSF, contrast sensitivity testing can capture the overall picture of visual function that visual acuity alone cannot show.
Visual function often declines first in contrast sensitivity, followed by a decline in visual acuity. Therefore, in cases where patients complain of blurred vision despite normal visual acuity, contrast sensitivity loss may be occurring first. This discrepancy is especially likely in the following situations.
- Fibrotic posterior capsule opacification: contrast sensitivity alone decreases while visual acuity remains 1.0 or better
- During recovery from optic neuritis: even if visual acuity improves to 0.8 or better, reduced contrast sensitivity may persist for a long time4)
- After multifocal IOL surgery: even when distance and near vision are good, contrast sensitivity tends to be lower than with monofocal IOLs5)
Patient-reported complaints such as blurred vision, strong glare, and difficulty seeing at night are strongly associated with reduced contrast sensitivity. Even when visual acuity is good, contrast sensitivity testing is useful as an objective measure when these complaints are present.
4. Clinical significance (indicated diseases and characteristic patterns)
Section titled “4. Clinical significance (indicated diseases and characteristic patterns)”| Disease/situation | Spatial frequency at which sensitivity decreases | Features and clinical significance |
|---|---|---|
| Fibrotic posterior capsule opacification | Medium to high frequencies (selective) | Contrast sensitivity decreases even with normal vision. Useful for deciding whether Nd:YAG laser posterior capsulotomy is indicated |
| Cataract | All frequency ranges (most noticeable at intermediate frequencies) | Sensitivity decreases under glare conditions due to scattered light. Especially prominent in nuclear cataract6) |
| Corneal irregular astigmatism (after refractive surgery) | High spatial frequencies (selective) | Reflects a reduction in the optical resolution limit |
| Optic neuritis, NAION | All spatial frequency ranges | After the acute phase, contrast sensitivity loss may persist even after visual acuity recovers4) |
| Amblyopia | Medium to high spatial frequencies (depends on type) | The pattern of reduction differs by type of amblyopia |
| Glaucoma | High spatial frequencies (early) | May be detected before visual field defects7) |
| After multifocal IOL and EDOF IOL implantation | Medium to high spatial frequencies | Contrast sensitivity tends to be slightly lower than with monofocal IOLs. Useful for preoperative counseling5) |
| Age-related changes | Across all frequency bands (earlier at high frequencies) | Even with normal aging, it gradually declines across all frequency bands3) |
Posterior capsular opacification and cataract play an especially important role in contrast sensitivity testing. In the Elschnig pearl type of posterior capsular opacification, visual acuity is usually already reduced, but in the fibrotic type, if mild, only contrast sensitivity decreases and visual acuity is preserved. Understanding this difference makes it possible to determine the indication for Nd:YAG laser posterior capsulotomy more appropriately.
In glaucoma, reports suggest that, based on a principle similar to high-pass resolution perimetry (HRP), reduced contrast sensitivity at high spatial frequencies may be detected before visual field loss7). However, because sensitivity and specificity are inferior to visual field testing, it currently plays only an auxiliary role.
Even when visual acuity is around 1.0, if there are complaints such as “blurred vision,” “strong glare,” or “difficulty seeing at night,” reduced contrast sensitivity may be present. It is especially likely to occur in posterior capsular opacification (fibrotic type), cataract, after refractive surgery, and during recovery from optic nerve disease. Performing a contrast sensitivity test allows quantitative evaluation of visual function loss that cannot be detected by visual acuity testing and enables objective judgment of the need for treatment. Start with a simple screening using the Pelli-Robson chart, and if needed, perform detailed evaluation by spatial frequency with FACT or CSV-1000.
5. Evaluation of posterior capsular opacification and Nd:YAG laser posterior capsulotomy
Section titled “5. Evaluation of posterior capsular opacification and Nd:YAG laser posterior capsulotomy”Indications for posterior capsulotomy are determined mainly by estimating visual functional impairment from the type and degree of opacity using slit-lamp retroillumination. Because visual function declines first in contrast sensitivity and then in visual acuity, measuring contrast sensitivity is useful when there is a complaint of blur but no decrease in visual acuity.
Types of posterior capsular opacification and effects on visual function:
- Elschnig pearl type (layered): residual lens epithelial cells proliferate and form layers on the posterior capsule. In many cases, vision has already decreased
- Fibrotic type (mild): causes only reduced contrast sensitivity, while visual acuity is preserved. In this case, visual function decline may be missed if only visual acuity is tested
If reduced contrast sensitivity can be taken into account when deciding on Nd:YAG laser posterior capsulotomy, it becomes easier to judge the appropriate timing of intervention even in cases where the patient’s main complaints (haze and glare) do not match the objective measurements.
Reference values for Nd:YAG laser posterior capsulotomy:
- Pulse energy: 1.0–2.0 mJ (start with low energy)
- Cutting pattern: cruciate or circular capsulotomy (aim for a diameter of 3–4 mm or more)
- Main complications: increased intraocular pressure (1–2 hours after surgery, managed with IOP-lowering drugs), IOL damage (pitting may occur), anterior vitreous prolapse
6. Measurement principle (spatial frequency theory)
Section titled “6. Measurement principle (spatial frequency theory)”Definition of contrast
Section titled “Definition of contrast”Contrast is defined by the Michelson formula.
Contrast (C) = (Lmax − Lmin) / (Lmax + Lmin)
Here, Lmax indicates the highest luminance of the stripes, and Lmin the lowest luminance. Contrast takes a value from 0 (uniform) to 1 (maximum). Contrast sensitivity (CS) is the reciprocal of the contrast threshold (the lowest contrast value that can be distinguished).
CS = 1 / contrast threshold
Band-pass characteristics of the human visual system
Section titled “Band-pass characteristics of the human visual system”The human visual system has band-pass filter characteristics and shows the highest sensitivity at mid spatial frequencies (3–6 c/d).
- Reduced sensitivity at low frequencies: due to lateral inhibition. Processing mechanisms in the retina and visual cortex suppress uniform low-frequency patterns
- Reduced sensitivity at high frequencies: due to the resolution limits of the ocular optical system (aberration and diffraction) and the sampling limit of retinal photoreceptors (cone spacing)
The density of foveal cones is about 150,000–200,000 cells/mm², and the sampling limit corresponds to about 50–60 c/d. The cutoff frequency of the actual CSF is lower than this because of optical aberrations.
Conversion between spatial frequency and visual acuity
Section titled “Conversion between spatial frequency and visual acuity”The relationship between spatial frequency (c/d) and visual acuity is as follows.
| Spatial frequency (c/d) | Equivalent decimal visual acuity |
|---|---|
| 3 | About 0.1 |
| 6 | about 0.2 |
| 12 | about 0.4 |
| 18 | about 0.6 |
| 30 | about 1.0 |
| 60 | about 2.0 |
Because the spatial frequency corresponding to visual acuity 1.0 is about 30 c/d, the high-frequency limit of the CSF is the point that corresponds to visual acuity on the CSF.
7. Latest Research and Future Prospects
Section titled “7. Latest Research and Future Prospects”The qCSF (quick Contrast Sensitivity Function) method uses an adaptive testing algorithm with Bayesian estimation to estimate the full CSF with one-third to one-fifth the number of trials required by conventional methods8). It greatly contributes to making psychophysical measurements more efficient and is moving toward clinical use.
Simplification of contrast sensitivity measurement using tablet devices is also advancing. Testing apps using smartphone and tablet LCD displays have been developed, and use for home monitoring and large-scale screening is expected9). However, calibrating display luminance and gamma characteristics is essential to ensure accuracy, and standardization remains a challenge.
In postoperative evaluation of multifocal IOLs and EDOF IOLs, contrast sensitivity is positioned as an important outcome measure. Efforts continue to objectively assess the impact of each IOL design on contrast sensitivity at intermediate to high spatial frequencies and use this in patient counseling and device selection5).
In the neuro-ophthalmology field, the usefulness of contrast sensitivity as an indicator of disease activity in optic neuritis and multiple sclerosis is being studied. Persistent contrast sensitivity loss even after visual acuity normalizes may reflect subclinical axonal damage4).
8. References
Section titled “8. References”-
Pelli DG, Robson JG, Wilkins AJ. The design of a new letter chart for measuring contrast sensitivity. Clin Vis Sci. 1988;2(3):187-199.
-
Ginsburg AP. Contrast sensitivity: determining the visual quality and function of cataract, intraocular lenses and refractive surgery. Curr Opin Ophthalmol. 2006;17(1):19-26. doi:10.1097/01.icu.0000192520.48411.fa. PMID: 16436920.
-
Owsley C. Aging and vision. Vision Res. 2011;51(13):1610-1622. doi:10.1016/j.visres.2010.10.020. PMID:20974168; PMCID:PMC3049199.
-
Balcer LJ, Miller DH, Reingold SC, Cohen JA. Vision and vision-related outcome measures in multiple sclerosis. Brain : a journal of neurology. 2015;138(Pt 1):11-27. doi:10.1093/brain/awu335. PMID:25433914; PMCID:PMC4285195.
-
de Vries NE, Webers CA, Touwslager WR, et al. Dissatisfaction after implantation of multifocal intraocular lenses. J Cataract Refract Surg. 2011;37(5):859-865. doi:10.1016/j.jcrs.2010.11.032.
-
Elliott DB, Bullimore MA. Assessing the reliability, discriminative ability, and validity of disability glare tests. Investigative ophthalmology & visual science. 1993;34(1):108-19. PMID:8425818.
-
Sample PA, Ahn DS, Lee PC, Weinreb RN. High-pass resolution perimetry in eyes with ocular hypertension and primary open-angle glaucoma. American journal of ophthalmology. 1992;113(3):309-16. doi:10.1016/s0002-9394(14)71584-3. PMID:1543225.
-
Lesmes LA, Lu ZL, Baek J, Albright TD. Bayesian adaptive estimation of the contrast sensitivity function: the quick CSF method. Journal of vision. 2010;10(3):17.1-21. doi:10.1167/10.3.17. PMID:20377294; PMCID:PMC4439013.
-
Hazel CA, Elliott DB. The dependency of logMAR visual acuity measurements on chart design and scoring rule. Optometry and vision science : official publication of the American Academy of Optometry. 2002;79(12):788-92. doi:10.1097/00006324-200212000-00011. PMID:12512687.